WorkShippedFeb 2026
GeoWatch
A geopolitical conflict tracker and macro dashboard on an interactive world map. My first build with Claude Code.
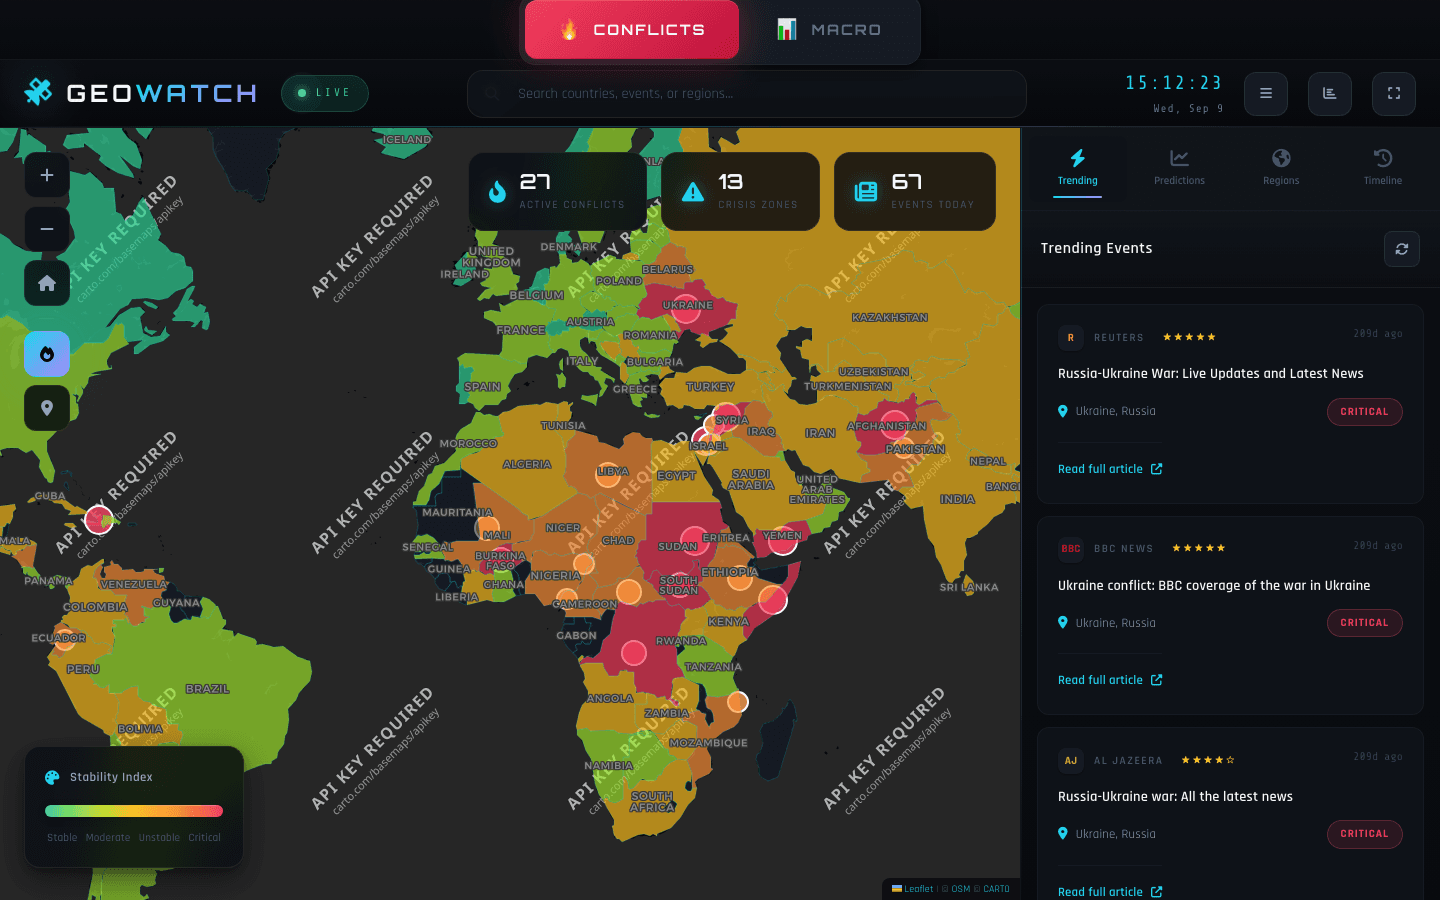
GeoWatch conflict tracker: a world map with countries coloured by intensity and a multi-source headline feed
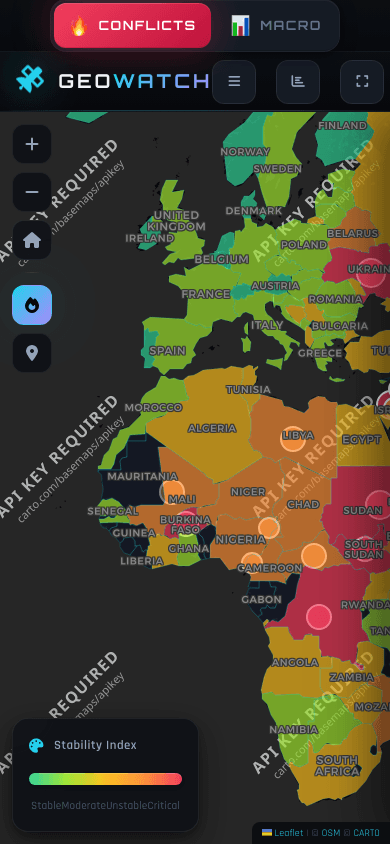
- GeoWatch on a phone
01What I built
Two trackers in one app, built in February 2026. The conflict tracker is a clickable world map coloured from stable to critical, with headlines aggregated from several news sources and automatic severity detection. The macro tracker adds an economic-health map, a central-bank rates panel, commodity and currency heatmaps, and an economic calendar. Plain JavaScript with Leaflet, a Python script for news fetching, deployed on Vercel.
02What I learned
This was the project where I found out I could ship something real without writing code, and also the one that taught me the difference between a tool that looks finished and one that is. The news integration is fragile because the sources change; the next projects had proper data pipelines with validation. I keep it on the list because it is where the six months started.
03Built with AI
Built end to end with Claude Code from a plain-language description. I evaluated it by using it every morning for a fortnight.